Introduction
In this introductory lab session, we have seen what a typical ultrasound image looks like and we have investigated a few parameters that affect image quality.
First, we noticed that without ultrasound gel between skin (or phantom) and transducer we don’t see anything. The ultrasound gel ensures that there is no air between the transducer and the skin. In fact, air has a much lower acoustic impedance compared to the transducer and causes the ultrasound energy to be reflected at the interface between transducer and air. More on the acoustic impedance in the lessons on Physics.
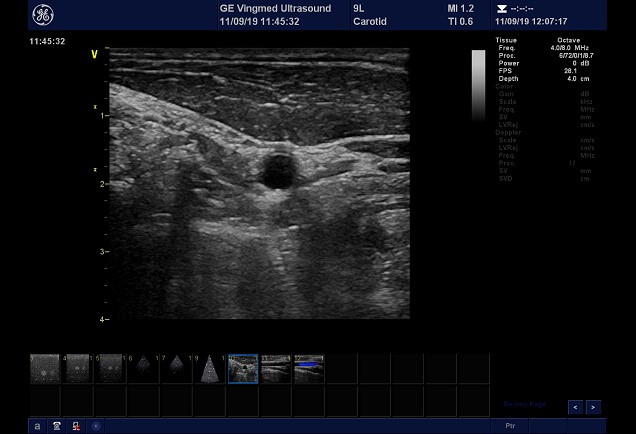
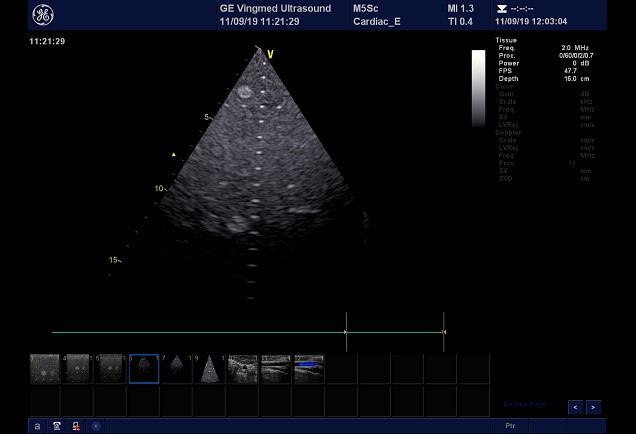
We started with the 9L transducer and imaged an ultrasound phantom. We obtained an image like this. Notice the shape of the image and the maximum imaging depth.
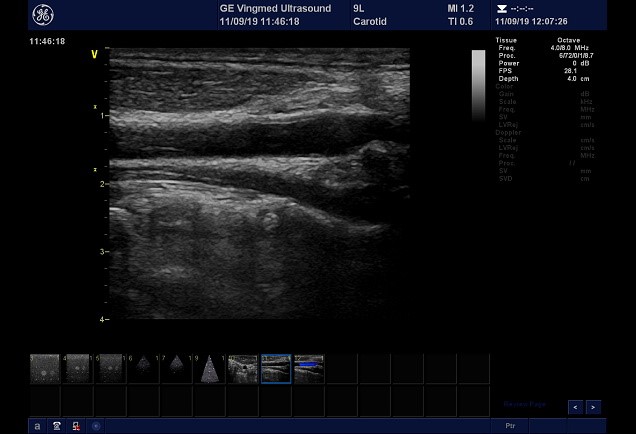
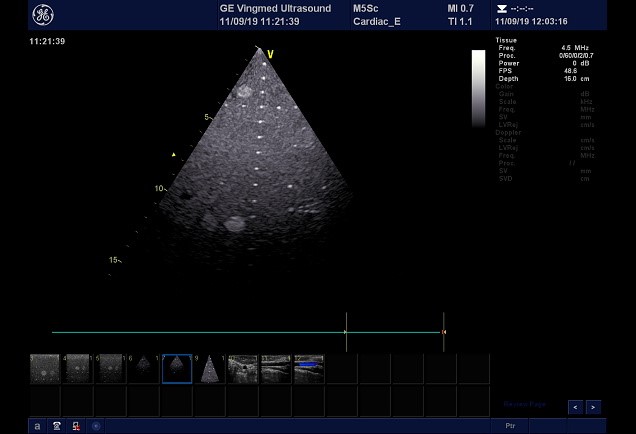
Then we turned a knob on the scanner to increase the frequency. You can see the current working frequency in the upper right corner of the picture.
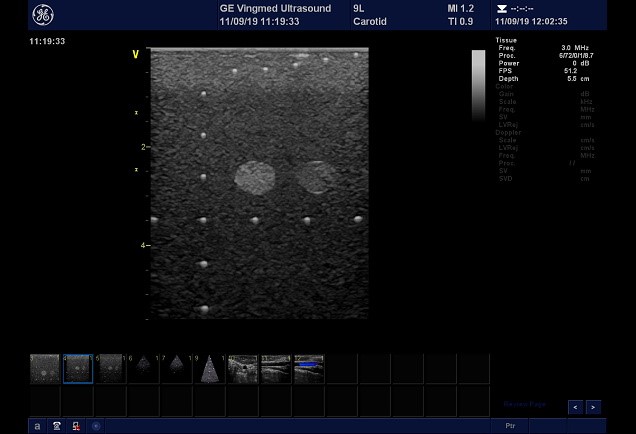
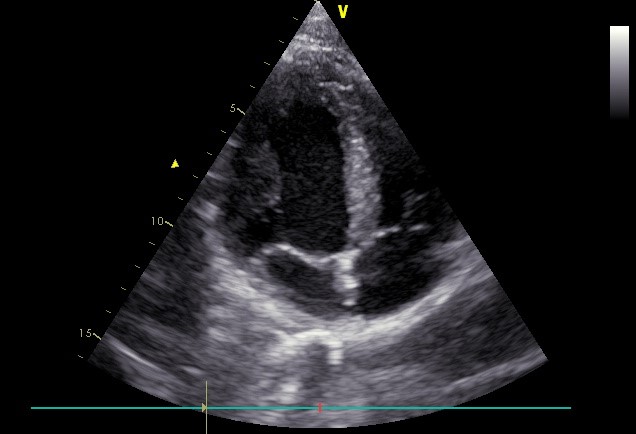
The resolution of the image improved. We can tell that by the reduced width of the bright spots. You will learn more on the relation between frequency and resolution in the Physics and Beamforming modules We switched to the M5s transducer and imaged the phantom again. We can immediately notice a difference in frequency, maximum imaging depth and shape of the image
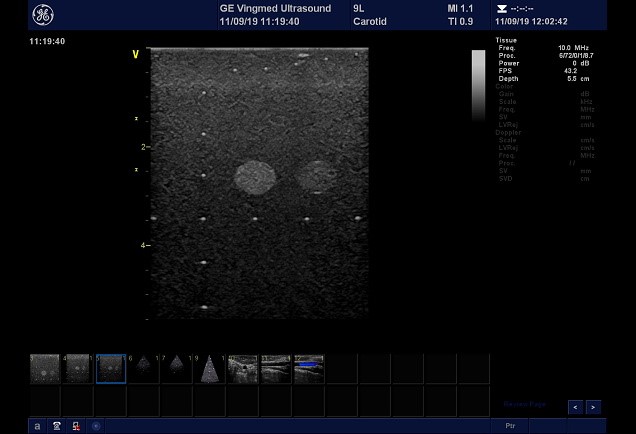
We also turned the frequency knob to increase the frequency
We can notice once more an improvement in image resolution. However, this time we also notice that we are not able to see the bright spots at higher depths. This happens because the ultrasound energy is attenuated as it travels through the medium and, as you may have guessed at this point, the entity of attenuation is proportional to the working frequency. We have just discovered a major trade-off in ultrasound imaging: resolution vs penetration. We’ll talk about it in the lessons on Physics. The ultrasound energy lost in the medium is converted into heat and causes its temperature to increase. This phenomenon must be taken into consideration when designing an acquisition sequence. More on this in the lesson on Safety.
If we compare the images from the M5s and the 9L we can notice that the images from the 9L look better than the M5s, even when the. Another property that affects imaging quality is the transducer size. You can see the 9L and M5s transducers side by side.
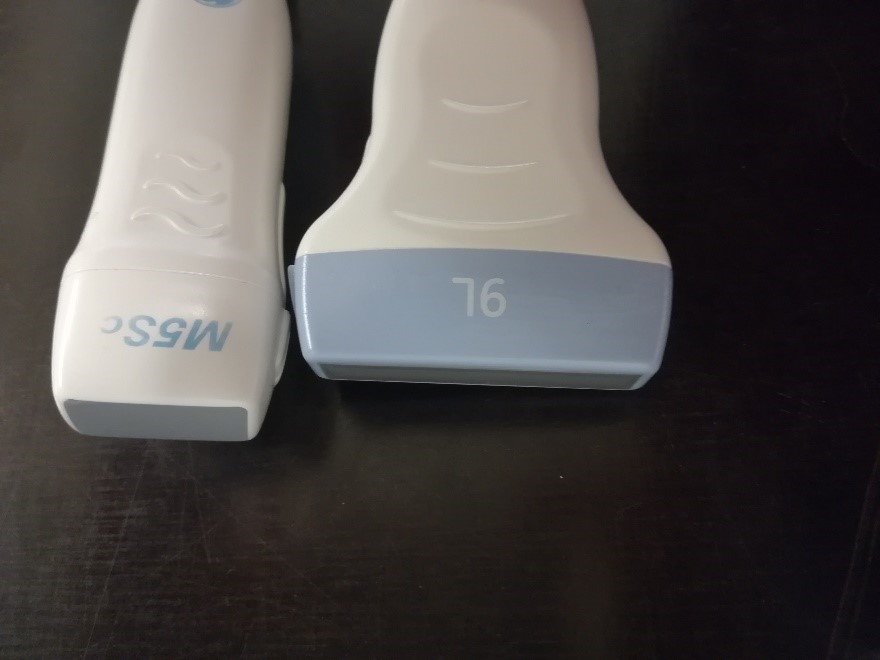
As you can see, the 9L transducer has a larger aperture than the M5s. More on this in the lessons on Beamforming and Transducers. Shape and center frequency of each transducer model are optimized for a specific application. The M5s is designed for cardiac imaging. The transducer must fit in the intercostal space, hence its small aperture. In cardiac imaging important structures such as the heart valves are located deep in the body (>10 cm), therefore the transducer is designed to work best at low frequencies (2-4 MHz)
The 9L is designed for vascular imaging. Many vessels of interest are located at shallow depths (< 5cm), therefore it is possible to use higher frequencies (5-8MHz). Because there are no physical limitations to the maximum aperture size as in cardiac imaging, a large transducer size is used to further improve the resolution.